


Spotify: A Kaleidoscope of Activity
Some thoughts on Spotify's 2022 Investor Day

Spotify hosted its first Investor Day in four years a couple weeks ago. I highly recommend watching the event and/or reading the transcript.
Here’s how I’d summarize the event:
While consolidated gross margins have been stuck in the mid-20%s for five years, the company’s music gross margins are “better than you think” at 28.3%, having improved by an average of 75 bps per year since 2018. That is primarily due to Marketplace initiatives, which contributed a stronger-than-I-expected €161 million of gross profit last year, having grown about 70%-80% year-over-year. Marketplace gross profit should grow another 30%+ this year. As a result, music gross margins are on a path to 30% within 3-5 years and then 35% long-term. That is without any reliance on renegotiations of headline royalty rates, which is not part of their strategy.

The music margin gains are currently being masked by the podcast business, which more than 4x’d last year to about €200 million of revenue and had -57% gross margin due to investment spending. But this year is the peak investment year for the podcast business. Margins should begin to scale next year, turn profitable in 1-2 years, reach 30%+ in 3-5 years, and could be 40%-50% longer term due to better operating leverage than in the music business.
Spotify is the world’s largest audio streaming platform with 422m+ MAUs. Management believes that scale allows it to layer on new verticals—audiobooks and then potentially news, sports, and education—onto that platform in single app, like they have with podcasting. That should accelerate the growth of new verticals by exposing them to existing the 422+ MAUs. And users who use multiple audio verticals are more engaged and have higher retention and LTV.
There appears to be a renewed focus on running all user-facing decisions through an LTV lens. To me, this discussion begged the question of “Has that not always been the case? If not, why not?” After all, Barry McCarthy, a big believer in LTV, had been the prior CFO for almost five years.
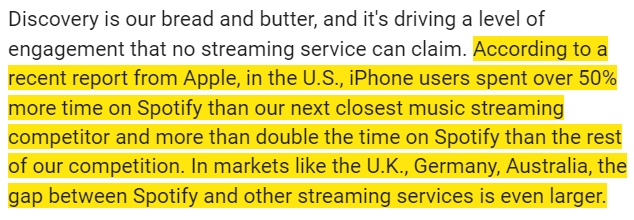
Premium churn (monthly) fell from 5.5% at the end of 2017 to 3.9% at the end of 2021. Developed market churn was down to 2.4% and churn in the most mature markets was down to 1%-2%. Spotify clearly has the lowest subscriber churn rate of any music streamer (see below), despite conventional wisdom that music streaming is an undifferentiated commodity. The lower churn is due to substantially higher levels of engagement relative to Apple Music and others.

The company expects to grow revenue at a 20% rate for the next decade due to subscription and advertising revenue growth. CFO Paul Vogel updated some of the company’s long-term margin targets (“long-term” meaning 10 years). The long-term music gross margin target is 35%, podcast is 40%-50%, and other new verticals are 40%-80%. It is not clear whether the consolidated gross margin target was updated from the prior 30%-40% to 35%-40% but that is the implication given the lowest-margin music business now has a long-term goal of 35%.
The R&D target is 10%-13% of revenue (down from 12%-15% at the 2018 Investor Day), S&M is 6%-7% of revenue, and G&A is 3% or less. Given these goals, Paul said to expect an operating margin of 10% with the potential for it to scale up “significantly” to the extent gross margin improves further. For reference, this compares to the 25%-35% revenue growth, 30%-35% gross margin, and 12%-15% R&D as a percent of revenue figures provided at their 2018 Investor Day.
Daniel cited some aggressive “within a decade” goals of $100 billion of revenue, a 40% gross margin, and a 20% operating margin. Those margin targets seem strong but reasonable, while the $100 billion of revenue seems very aggressive. For context, in my last published scenario analysis (see Spotify: The Leverage We Can’t See), my Base case had €38 billion of revenue in 2032. That said, I have never included audiobooks or the other verticals management discussed in my work. If Spotify achieves the implied $20 billion of operating income in 10 years, the business would be trading for 0.8x 2032 EBIT right now. It wouldn’t be surprising if it traded for 12x-15x EBIT by then, implying the business would be worth about 15x-18x more than it’s trading for today. That suggests 31%+ annualized returns for a decade.
MAUs and Premium Subs
While management reiterated the long-term goal for 1 billion MAUs, I found it interesting how no commentary was provided about long-term goals for Premium subscribers. In fact, when Paul Vogel was discussing the big drivers of management’s 20% long-term revenue growth goal, he mentioned “continued subscriber growth over the next 3-5 years.” I was struck by that. That seems to suggest a lack of confidence in significant subscriber growth beyond 3-5 years.

I think that probably makes sense. When I look at Premium subs as a percent of total MAUs by region, it is possible that Europe may have peaked at 53% last year (now 51%). North America’s rise has stalled at 55% for almost a whole year. Latin America may have peaked at 43% in 2018 and again in 2020 (now 42%). Rest of World, which is growing total MAUs at a 35% rate—more than twice as fast as every other region—peaked at 40% in 2018 and is now just 21%. Here’s a screenshot from my model:
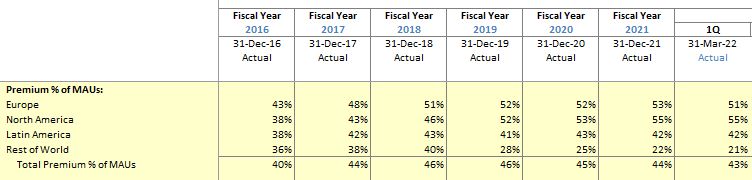
Simply put, Rest of World is the largest single driver of MAU growth yet almost 90% of MAUs there are free Ad-Supported MAUs. For example, 1Q had 25 million new MAUs year-over-year and just 3 million of them were Premium subs. To the extent this continues, this RoW growth should cause a mix shift that could drive that 43% Premium penetration rate down into the 30%s over time.
So if Spotify has 700 million or 1 billion MAUs in the long run, maybe it will have something like 250-400 million Premium subs or roughly 35%-40% Premium sub penetration. It already had 182 million Premium subs at the end of March, so I can appreciate that Premium sub growth may not be a big growth engine forever. That said, management will probably flex some pricing power over time in regions as they mature such that q will slow but p should then begin to pick up some slack.
From a modeling perspective, which you can see linked below, I’ve lightened up a bit on my Premium subscriber growth numbers to reflect my interpretation of this commentary. In my prior Base case, I had 337 million Premium subs and 772 million total MAUs in 2030 with both growing at a low single digit rate from there. That’s a 43.7% Premium penetration rate, which now seems more likely to come down over time. I think that total MAU number could still be in the ballpark (not willing to use their 1 billion target in my Base case), especially given the impressive progress cited in India…


… but I’ve lowered my Premium sub number in 2030 to 268 million. That would be a 37.2% Premium sub penetration rate. That could be too much of a haircut, but if I’m going to be wrong (and I will be) I’d rather be too low than too high. I think it’s important to make these tweaks based on new information or realizations. And to make an effort to be objective and dispassionate about it. Philip Tetlock’s Superforecasting discusses how the most accurate superforecasters in the world are constantly adjusting their forecasts based on new information. Of course, doing that still doesn’t give any of us a crystal ball but I do think it can improve our forecasting.
By the way, I think this slide gets at what management may be basing its 1 billion MAU figure on. If that 2.7 billion MAU TAM in emerging markets gets to the same 32% penetration that’s seen in established markets today (U.S., Western Europe, Australia, New Zealand), that would add 648 million MAUs. On top of today’s 422 million, they would have 1.07 billion. If that’s their methodology, I have two observations: 1) getting up to 32% penetration in emerging markets is far from certain just because it has achieved that in established markets, and 2) 32% penetration in established markets does not seem to be any sort of plateau to anchor on. For example, the Europe and North America regions still saw 13% MAU growth last year and 14% and 13%, respectively, in the first quarter. In a decade, this slide might show an 800 million TAM with 40% penetration in established markets.

Music and Marketplace
In my March post called Spotify: The Leverage We Can’t See, I wrote about Marketplace’s contribution towards consolidated gross profit over the years:

At the Investor Day, the company disclosed that Marketplace’s contribution to gross profit in 2021 was actually €161 million. As you can see, I had estimated €90 million based on the “a material increase again” language and extrapolated the ~€30 million increase from the prior year. It’s a bit surprising that the somewhat subdued “a material increase again” language really meant “it had a breakout year, exploding higher and almost tripled.”
Here’s an updated exhibit for the new information we have.